
Here’s the March 2023 installment of our monthly Netra report. Netra aims to bring forward the latest economic highlights and trends that have shaped the past few months.
In the March 2023 Netra, we talk about the year of oil and war, how India has shaped its economy amidst rising global uncertainties and instability, and how the Indian markets are normalizing after the effects of the pandemic.
Let us get started.
India delivering higher returns than China

Source: Bloomberg; Data as on Feb 2023
Since it joined the World Trade Organization (WTO), China has been the top destination for investments. It has grown significantly and in such a fierce manner that no country has ever done before. In fact, it has received one of the largest shares of foreign portfolio investments on a global level.
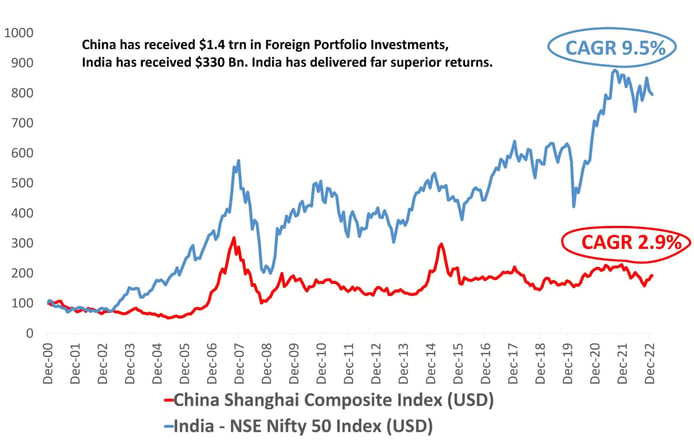
But despite the heavy investment, it has failed to deliver returns. This is where India comes in as a force to reckon with. While China has received $1.4 trillion in Foreign Portfolio Investments over the last two decades, India received just about $330 billion. However, India has delivered far superior returns compared to China – almost 6.6% higher (in USD terms). As seen from the chart above, the China Shanghai Composite Index has delivered a CAGR of 2.9% since December 2000. At the same time, the NSE Nifty 50 Index has delivered a pleasant 9.5% CAGR.
Additionally, global investors have often expressed concern about ambiguity regarding who the ultimate beneficiaries of Chinese businesses are and whether Chinese businesses are profit-focused. This builds a case for India, with its free markets and businesses focused on profits, to receive higher global investments going forward.
An upsurge in investments
Source: World Bank, Govt Documents; Data as on Feb 2023
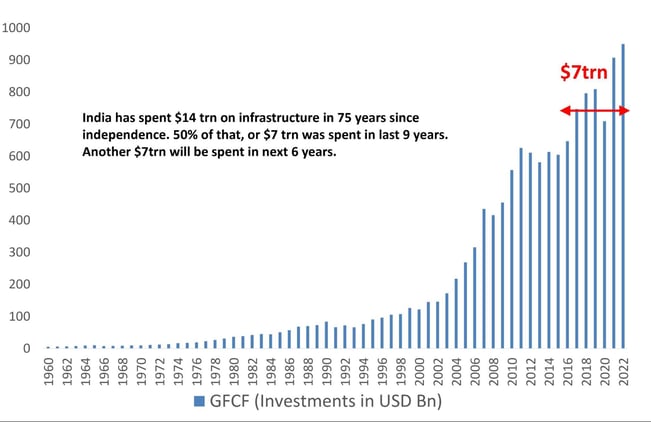
In the 75 years since Independence, India has spent $14 trillion on infrastructure. Half of that ($7 trillion) was spent in the last nine years.
This chart and the '$14 Trillion' statement from #DSPNetra became quite famous. Infact there are articles being written to refute or inflation adjust it.
— Sahil Kapoor (@SahilKapoor) March 17, 2023
Watch this 7 min clip to understand deeper nuance of this data: https://t.co/fMLFymK6Ik pic.twitter.com/F1yKOxSGMn
This is probably proof that the lull in investment growth is finally seeing an end. There has also been a visible push in Government expenditure as well as private capital expenditure. The investment (gross fixed capital formation) to GDP ratio was at a peak in 2011. This was followed by a period of lows until the disruption by the pandemic upended supply chains. Going ahead, we will likely spend about the same - $7 trillion on investments - but within the next six years. What does this indicate? That the capex cycle will likely surprise on the upside in the next few years.
De-levering of corporate India
Source: Bloomberg; Data as on Feb 2023
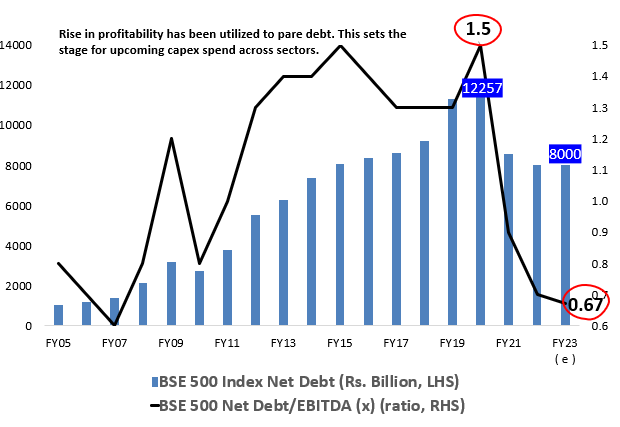
Corporate India saw record profitability in the financial year 2021-22. The profits earned have been utilised to pare down debts, which has further improved the financial condition of corporates and strengthened their balance sheets.
As seen from the chart above, in FY20, the BSE Index 500 Net Debt stood at Rs. 12,257 bn. This figure has come down to Rs. 8,000 bn in FY23. Moreover, the net debt to EBITDA ratio levels have halved from 1.5 in the COVID-struck FY20 to 0.67 in FY23, a six-year low.
With these healthy financials, corporates have become more receptive to the idea of increased spending. This augurs well for the capital expenditure cycle. The private sector capital push is likely to complement the increase in Government spending, giving a major boost to infrastructure and ancillary services sectors.
Banking in the pink of health
Source: Investsec, DSP; Data as on Feb 2023
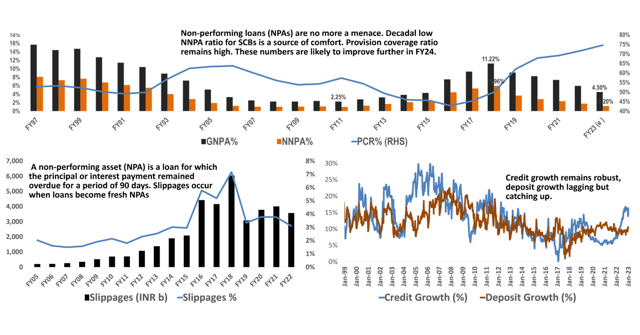
The banking sector is in great shape and is perfectly positioned to benefit from India's steady economic growth story. There is robust growth in credit disbursals as well as deposits.
The pain point of Non-Performing Assets (NPAs) has now been brought under control. NPAs are loans on which the interest or principal payment remains overdue for over 90 days. In FY23, the Gross NPAs are estimated to stand at 4.50%, down from 11.22% in FY18. Another source of comfort is the decade-low Net NPA ratio for SCSBs.
Additionally, the provision coverage ratio remains high, nearing almost 75%. These numbers are likely to improve further in the coming years.
Hope for normalcy in India’s external situation
Source: Bloomberg; Data as on Feb 2023
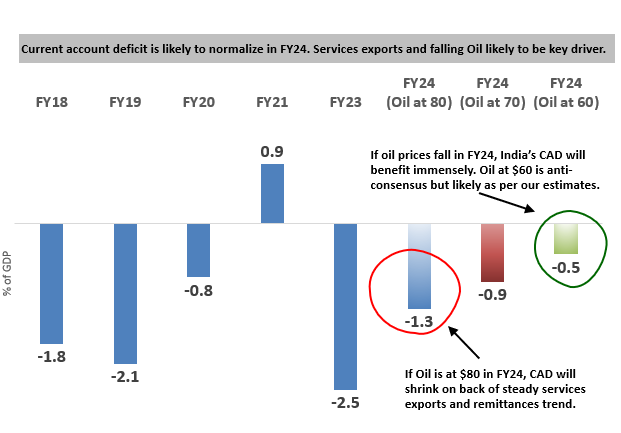
The huge surge in global oil prices (up to $110 per barrel) and our steep manufacturing imports basket had a deep impact on India's trade deficit. In fact, from April 2022 to December 2022, India recorded a monthly trade deficit of $27 billion, a new high.
However, since then, oil prices are seen to be normalising, and supply chains have been mended, reaching normalcy. This has improved India's import bill. At the same time, service exports in India are blooming.
A combination of these factors is likely to take some load off India's current account. In FY23, the current account deficit is at -2.5% of GDP. Going into the next year, should oil prices decline to $80, and the trend of steady services export and remittances continue, the current account deficit (CAD) may shrink back to -1.3%. As shown in the chart above, if oil prices slip to $60, the CAD will benefit immensely, lowering to -0.5% of GDP.
This is also likely to benefit the Rupee in the coming financial year. The RBI may then leverage it to better manage India's external situation and foreign exchange policy.
A year of consolidation in US markets could benefit Indian equities
Source: Bloomberg; Data as on Feb 2023
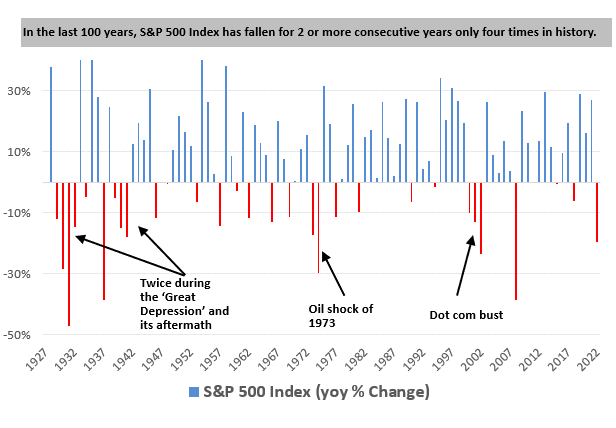
As the largest of the developed markets, the US equity market has always set the tone for global investor sentiment. If we look at the S&P 500 index during the last century, there have been only four instances when the index has delivered negative returns in two or more consecutive years (see chart above). Twice was during the Great Depression, followed by the oil shock of 1973, and finally when the dot-com bubble burst
In the calendar year 2022, the US markets closed in the red. Based on how things have worked out in the past, it is likely that the US equities will remain in broad consolidation in the near-term instead of seeing deep corrections.
An increase in oil and gas capex
Source: IEF & S&P Global Commodity Insights, Data as on Feb 2023
Upstream oil and gas industry has witnessed increased investment in recent times. Upstream O&G companies are those that search for oil and gas deposits and extract them.
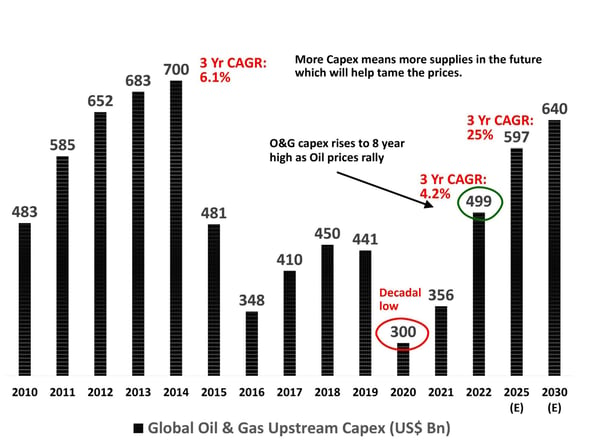
In 2020, crude oil prices were at $41.96 per barrel. It was also the year when capital expenditure (capex) in this industry was at a decadal low of $300 billion. However, in 2022, an increase in demand for oil caused oil prices to shoot up to over $110 per barrel! The high prices made this a lucrative sector for investment. With a three-year compound annual growth rate (CAGR) of 4.2%, oil and gas capex rose to an eight-year high of $499 billion in 2022.
More capex implies more supply in the future, which is expected to help in taming the oil prices. Additionally, it is estimated that by 2025, oil and gas capex will rise to $597 billion, displaying a three-year CAGR of 25%. By 2030, capex in this sector is estimated to be $640 billion.
Looking at the demand side, oil demand in the auto sector might take a hit. Road transportation accounts for almost half of the world's oil demand. The US and China markets account for 40% of the total vehicles sold globally. However, auto sales have not grown in these markets in the last five years. Adding to this fact is the incremental sales moving towards electric vehicles, which can dent oil demand from this sector in the next few years.
Commodities slipping into a bearish territory
Source: Bloomberg; Data as on Feb 2023
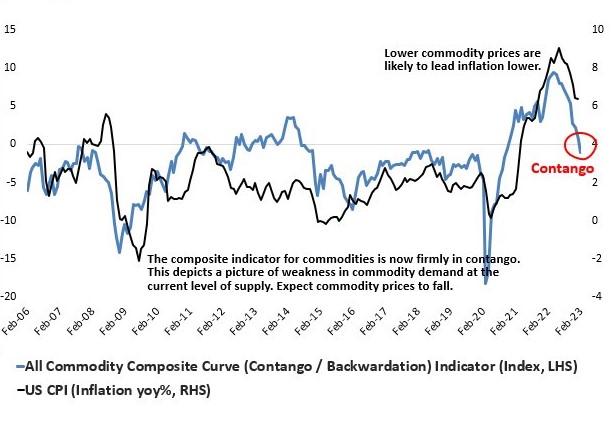
Backwardation is a condition when the futures market is abnormal. Here, the price of a futures contract that is months away trades at a discount to the near-month prices. Because commodities have a "cost of carrying" or a storage cost associated with them, they should ideally be more expensive in the future. But under backwardation, the current prices tend to be higher. On the flip side, contango is a situation where normal market conditions prevail, which usually coincides with normal levels of inflation.
Backwardation occurred in 2022 as a result of a supply crunch. However, if we now view the commodity curve for composite futures (as plotted in the chart above), we can see that commodities are clearly back in contango. Lower prices of commodities are back, leading to lower inflation.
The bottom line
Despite global uncertainties such as ongoing wars, geopolitical crises, and surging oil prices, India has stood its ground. The economy is on the path to normalcy, corporates have strengthened their balance sheets, there is increased capital expenditure in infrastructure, and the banking sector is in great shape. It can be a great time for India to push its growth horizon.


Leave a comment