
Post a period of unprecedented monetary stimulus as well as labor market and supply chain shocks on account of COVID-19, inflationary pressures have been acting up. Inflation now dominates investor sentiment.
Investors are rightly worried about the impact of inflation on stock prices. Inflation impacts could be very different on growth, profitability margins, demand, etc., depending upon the nature of the business. To get a historical perspective on potential inflation impacts, we looked at past data in periods where inflation was trending up and reviewed factor behavior in such times. We believe that this could help investors in gauging probable future outcomes and help to manage investment portfolios accordingly.
For a reader new to the concept of factor investing, factor strategies - sometimes known as smart beta strategies - build portfolios that are designed to harvest alpha (Read: extra returns) associated with factors. In our study, we look at three predominant factors - quality, growth, and value.
The Quality factor represents companies that have a durable business model with sustainable competitive advantage, are profitable and are better positioned to withstand economic downturns. Common descriptors of quality include return on equity, low leverage, low variability in earnings growth, high profitability, etc.
The Growth factor is characterized by companies that have grown their earnings at a faster clip and/or have better growth prospects. Common descriptors of growth include sales growth, trailing or forward EPS growth, etc.
The core thesis behind Value factor is that cheaply-priced securities tend to outperform richly-valued securities over the long horizon. While there still is a lack of consensus within the investment community with regards to how to best capture ‘Value’, metrics such as Price-to-Book, Price-to-Earnings, EV/EBIDTA, Dividend Yield and Free-Cashflow yield are the commonly used measures of Value factor.
For a detailed understanding of factors, do read our note ‘ Introduction to Factor Investing’ available at this link.
Factor Cyclicality
Factors are known to be cyclical. To study the impact of inflation on factors, we have characterized the periods between Sep 2005 and Sep 2021 using macro indicators - OECD India CLI (an indicator of growth) and India CPI growth rate (YoY) as an indicator of inflation. The periods under study represent ‘Overheating’ and ‘Stagflation’.
- The overheating period corresponds with rising OECD India CLI (robust growth) accompanied by rising CPI
- The stagflationary period corresponds with falling OECD India CLI (slowing growth) and sticky/rising CPI
During these periods, we analyzed the returns of Quality, Growth and Value factor portfolios and compared them with the BSE 200 TRI (representing broad market) and the Quant model (multifactor).
Note: Single-factor portfolios are created out of stocks displaying high values on the respective factor. Multi-factor refers to an approach where portfolios are created combining the attributes of two or more factors (in this analysis, three factors - quality, growth and value).
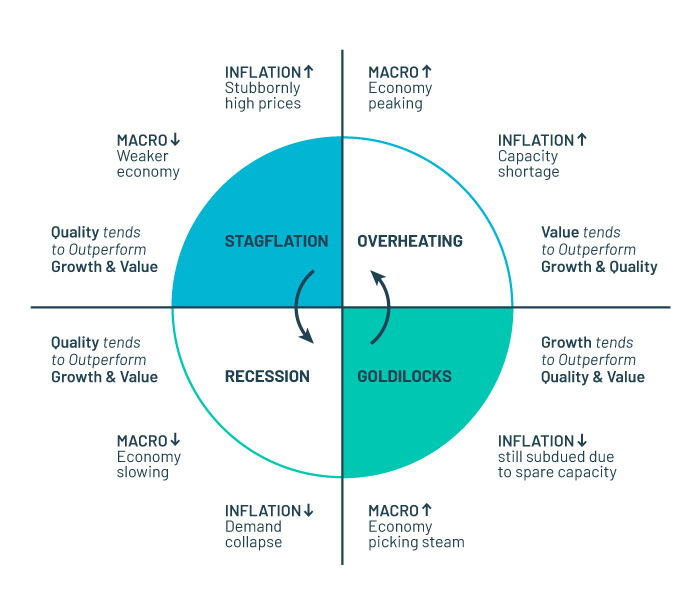
Factor behavior in ‘Overheating’ economic phase:
‘Overheating’ economic phase: Characterized by rising inflation and rising economic output.
During an economic upswing, cyclical companies, including resource producers and those with high operating leverage outperform as demand outstrips supply and idle capacity is put to use, helping such companies improve profitability non-linearly. At such times, asset prices go up supported by monetary and fiscal policies still geared towards economic revival. Highly leveraged companies benefit as their earnings go up, thereby improving their debt servicing ability. These companies typically fall under the Value factor. Such companies tend to outperform during the overheating phase.
Defensives/Consumer stocks, on the other hand, are typically price takers. In this phase, the sudden rise in input cost cannot be fully passed onto the end consumers. This usually results in eroding margins while still growing in volumes. Hence, these companies typically underperform (Quality factor).
In general, such periods see strong equity returns.
All returns are compounded annualized returns
Factor behavior in "Stagflation" economic phase
‘Stagflationary’ economic phase: Characterized by rising inflation and slowing economic output
As rising prices begin to pinch, consumers curtail discretionary spending and the economic output slows. Inflation tends to remain sticky for a while. This is also the period where monetary and fiscal stimulus measures are withdrawn on account of rising inflation and there is a normalization of interest rates. As seen below, Value factor tends to underperform as demand destruction and higher debt in the capital structure accompanied by rising rates lead to rising interest outgo, thus impacting profits for the companies. Resource producers face declining prices as demand starts slowing and may even decline.
The Defensive (Quality factor) companies are able to broadly maintain margins because of better pricing power, brand strength and non-discretionary demand. They also have low debt. Examples are FMCG, pharma companies.
We also see that such periods usually are accompanied by negative real returns in equity as an asset class.
All returns are compounded annualized returns
Conclusion
Our analysis shows that overheating periods typically see positive equity returns, with outperformance by ‘Value’ factor. Stagflationary periods see negative equity real returns with outperformance of ‘Quality’ factor. Overall, our multifactor model appears able to successfully navigate through these periods, while doing better in stagflationary periods as compared to overheating periods. Investors would, thus, likely benefit by having a balanced and well-diversified portfolio rather than rely on outperformance of few sectors and narrow segments of the market.


Leave a comment