
Welcome to the February 2024 edition of Netra, where we present data-driven market insights that can inform your investing decisions.
This month, we’ll talk about some potential turbulence that could be on the cards for the markets in the near future, the premium that Indian small- and mid-cap (SMID) stocks are currently commanding, and the factors supporting lower bond yields in India.
Is the market party about to end?
The BSE Sensex Index has now gone for almost 8 years with relatively low volatility, and without a bear market.
While there are several ways to define a bear market, our definition here is: a decline of more than 20% accompanied by a time period of more than one year to regain previous highs.
When COVID struck, the Sensex did decline nearly 40%, but the markets recovered in about 9 months to reclaim all-time highs. As a result, that period doesn’t count as a bear market by our definition.
So far, so good. Can we, then, expect a few more years of such low-volatility performance?
Perhaps not: the smooth sailing that Indian investors have got used to could be coming to an end soon. If we zoom out and look at long-term trends, what we see is that the market is due for a choppy period with much larger drawdowns.
The chart below tells you a couple of key things. First, the last time we had such a stable and smooth market was way back in the 1980s. Second, low-volatility periods eventually give way to higher volatility. When will this happen next? No one can tell for sure.
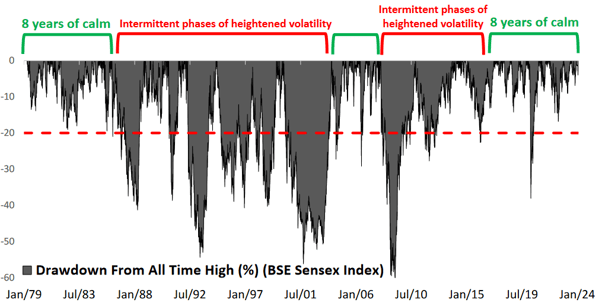
Source: BSE, DSP. Data as of Jan 2024.
Insights from the performance of small- and mid-cap indexes
However, there’s a different set of data that suggests that this transition might be imminent. If you look at the tables below, you’ll see that the number of down days seen by the small- and mid-cap indices in 2023 neared those seen in previous best years. It’s rare to get such ‘all boats sailing’ uptrend years, and there’s a cost attached to them. In the past, such years have seen higher-than-average drawdowns in the following year.
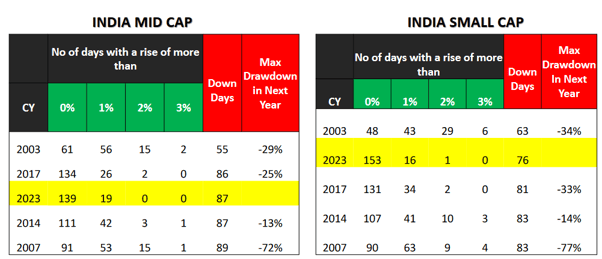
Source: S&P BSE, Bloomberg. Data as of Jan 2024.
The average calendar-year drawdowns for large-cap, mid-cap, and small-cap indices are 19%, 23%, and 26% respectively. But if you consider only the top 5 years with ‘unnervingly calm’ bullish performances, the average calendar-year drawdowns go up to 27%, 32%, and 37% respectively.
Simply put, this means that calm years are followed by years of relatively high volatility and drawdowns. Hence, you should expect markets to become volatile in 2024.
An additional catalyst
An impending bout of volatility is made more likely by the fact that nearly half of the world’s population is going to vote this year, which will introduce a fair amount of uncertainty from a policy-making standpoint. Historically, such uncertainty has been a source of heightened price swings.
Is there a bubble in the SMID category?
After SMID stocks posted better-than-expected numbers in Q1 2023, domestic investors as well as foreign portfolio investors (FPIs) began placing big bets on them. Such stocks are also typically attractive because in growing economies such as India, they tend to perform better than large-caps.
The graph below indicates that India’s small-caps are valued at a significant premium compared to small-caps in the US and China.
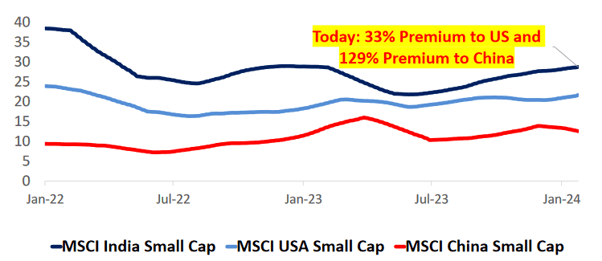
Source: Bloomberg, DSP, Nuvama. Data as of Jan 2024.
More broadly, India’s SMID stocks currently have a valuation premium of more than 60% compared to the rest of the world.
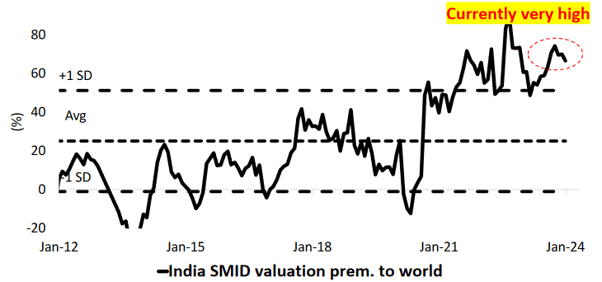
Source: Bloomberg, DSP, Nuvama. Data as of Jan 2024.
Analysts are divided as to what this really means: is this a bubble borne of irrational exuberance, given that SMID fundamentals haven’t really changed much, or a resolute belief in the SMID space?
The confluence of factors dragging bond yields down
In early February 2024, soon after the federal interim budget indicated that the government would reduce borrowing in the coming year, Indian government bond yields fell sharply, and the benchmark yield posted its biggest drop in more than a year. While the fiscally prudent budget was the immediate reason for this decline (along with falling US Treasury yields), there are several other factors that will continue to exert a downward pressure on bond yields for some time.
For one thing, the fall in the supply of bonds (resulting from lower government borrowing) is likely to be met with increased demand, particularly from FPIs. As you can see in the chart below, there’s likely to be a much bigger mismatch between supply and demand in FY25 than in FY24. Greater demand will mean higher bond prices, which will translate to lower bond yields.
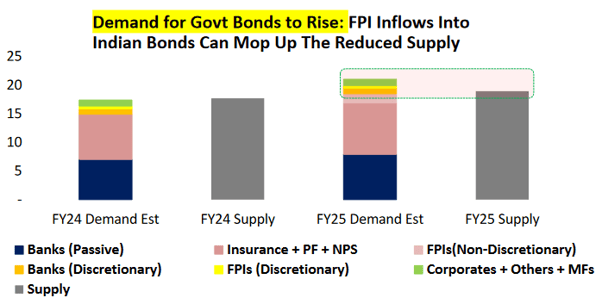
Source: Bloomberg, CMIE, Budget Documents, DSP. Data as of Jan 2024.
Moreover, YoY core CPI has been going down, as can be seen below. While the RBI has held the repo rate constant at 6.5% for a while now, a continued downward trend in the core CPI could prompt the RBI to finally bring the repo rate down, which would also bring down bond yields.
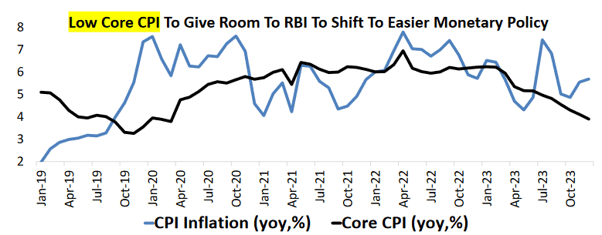
Source: Bloomberg, CMIE, Budget Documents, DSP. Data as of Jan 2024.
The bottom line
The big message here is that retail investors will need to be cautious in 2024, given that it could turn out to be the start of a period of major volatility, especially in the SMID space, because of its rather rich valuations.
For more actionable insights, along with data and analyses on the state of the US economy, we invite you to read the latest edition of Netra in its entirety.


Leave a comment