-2.jpg)
The October 2023 edition of Netra is here, shedding light on pivotal financial developments and trends shaping the global economy. This month, we delve into the unexpected surge in US 10-year bond yields, tracing its historical significance and its curious divergence from current economic indicators.
Furthermore, we probe into the sustained growth of US corporate profits over the last two decades and the challenges posed by escalating interest rates. We also navigate the intricacies of Nifty's current valuations, emphasising the emerging inclination towards multi-asset investing. Through this detailed exploration, Netra aims to empower you with a clear understanding and perspective, ensuring you're well-equipped to make informed investment decisions in this continually shifting economic landscape, where strategic foresight and adaptability are key.
Understanding the rise in US bond yields
Source: FRED, DSP; Data as on Sep 2023
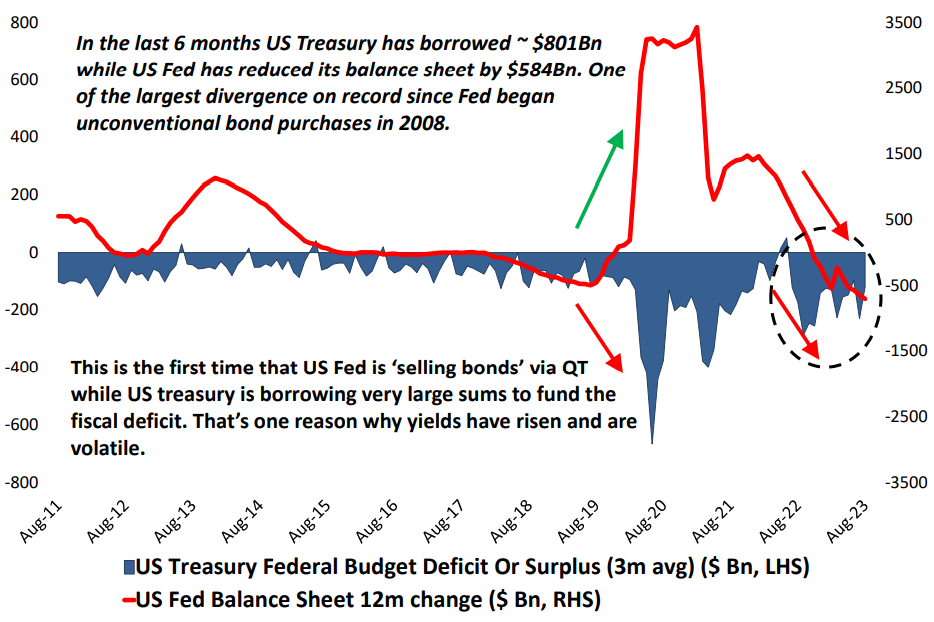
The US 10-year bond yield has surged to 4.7%, a rate last seen 16 years ago, which seems counterintuitive given some current economic indicators. The US Personal Consumption Expenditures Deflator has decreased to 2.1% over the prior three months, suggesting disinflation. Additionally, there's been a downturn in US manufacturing for the majority of 2023, coupled with slowed credit growth.
Typically, bond yields mirror economic growth and inflation, so why this unusual yield increase? A significant factor is the US's large budgetary deficits. Unlike previous patterns, the US Federal Reserve is selling bonds, not supporting the US treasury, at a time of high fiscal deficits and record-level monthly borrowings. This unprecedented scenario of the Fed offloading bonds through Quantitative Tightening (QT) while the treasury borrows heavily is a key driver behind the rising yields. However, this ascent might be tempered by the potential economic slowdown. Notably, over the past six months, the US Treasury has borrowed roughly $801 billion, while the Fed has reduced its balance sheet by about $584 billion, marking a significant disparity since 2008 when unconventional bond purchases began. This simultaneous large-scale borrowing by the US treasury and the Fed's bond sales largely explains the volatile bond yields.
Rising interest rates: A potential threat to two decades of US corporate profit growth
Source: FRED, DSP; Data as on Sep 2023
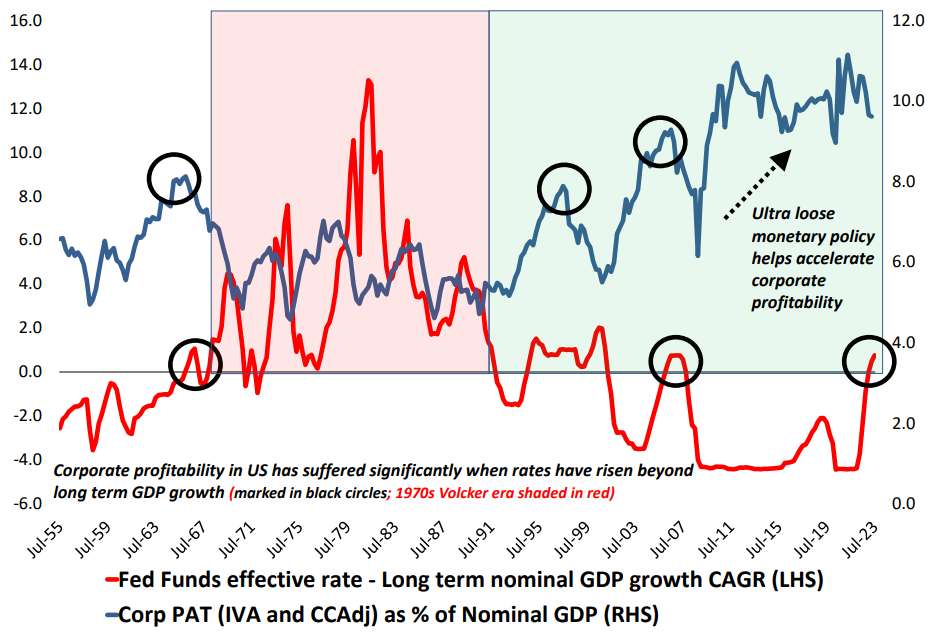
Over the past two decades, US corporate profits have seen a significant rise, driven mainly by two factors.
Firstly, the ultra-loose monetary policy, in place for about 30 years, gained prominence, particularly after the 2008 global financial crisis, marked by the introduction of quantitative easing.
Secondly, the remarkable profitability of tech companies, which are predominantly US-based and dominate a large portion of the global market, has bolstered this trend.
However, history provides an essential insight: when US interest rates surpass the long-term nominal GDP growth rate (at 4.5% CAGR), there's a marked decline in corporate profitability. This decrease can be attributed to diminished demand, resulting from higher interest rates that suppress the economic appetite for goods and services. The current scenario aligns with this historical trend, suggesting that corporate profitability might be at risk as interest rates rise.
Nifty's current valuations: The shift towards multi-asset investing
Source: Bloomberg, NSE, DSP; Data as on Sep 2023
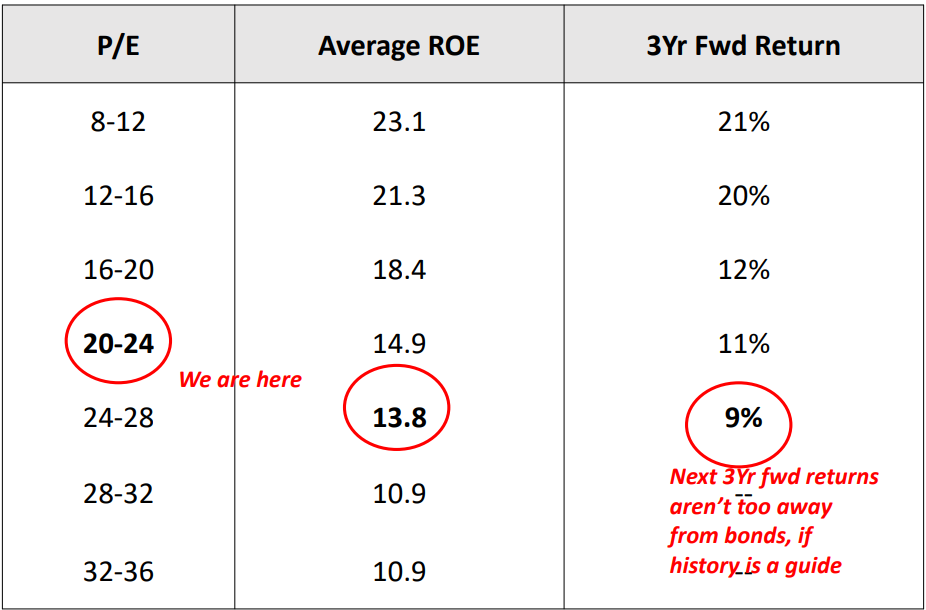
Currently, the valuation of Nifty stands at 22.7 times its past earnings, coupled with a Return on Equity (ROE) of 13%. Based on historical trends, when Nifty's valuations align with these figures, the anticipated forward returns typically fall below 10%. Comparatively, the 10-year Government Securities (GSec) offer a yield of around 7.2%, and AAA-rated corporate bonds are yielding 7.75%. These bond yields are making bonds an increasingly appealing investment option, reducing the allure of equities.
Furthermore, as investors pay higher premiums for companies, pushing valuations further, the potential to achieve returns beyond the average diminishes. Therefore, the advised strategy is to diversify one's investment portfolio across various asset classes, promoting a multi-asset approach.
The bottom line
As the economic fabric continues to change, the insights and analyses presented in Netra are crucial for any investor or stakeholder aiming to navigate the uncertainties with clarity. Armed with this knowledge, the discerning reader is better poised to strategise, adapt, and optimise in an ever-fluid economic context, ensuring not just survival but thriving in the face of evolving challenges and opportunities. You can access the full report here.


Leave a comment