
The sharp outperformance of ‘value’ stocks over the last two years has revived investor faith in value investing. This has been accompanied by some loss of faith in the ‘quality’-oriented investment style that has underperformed over the same period. ‘Quality’ is sometimes seen as the antithesis of ‘value’ because of the premium valuations of ‘quality’ companies as seen through the lens of conventional valuation metrics such as Price-to-Earnings Ratio, Price-to-Book Ratio, etc.
Most ‘quality’-oriented portfolios tend to have some “expensive” stocks, so we thought it would be worthwhile to find out whether such expensive stocks actually underperform benchmarks, and should therefore be systematically avoided.
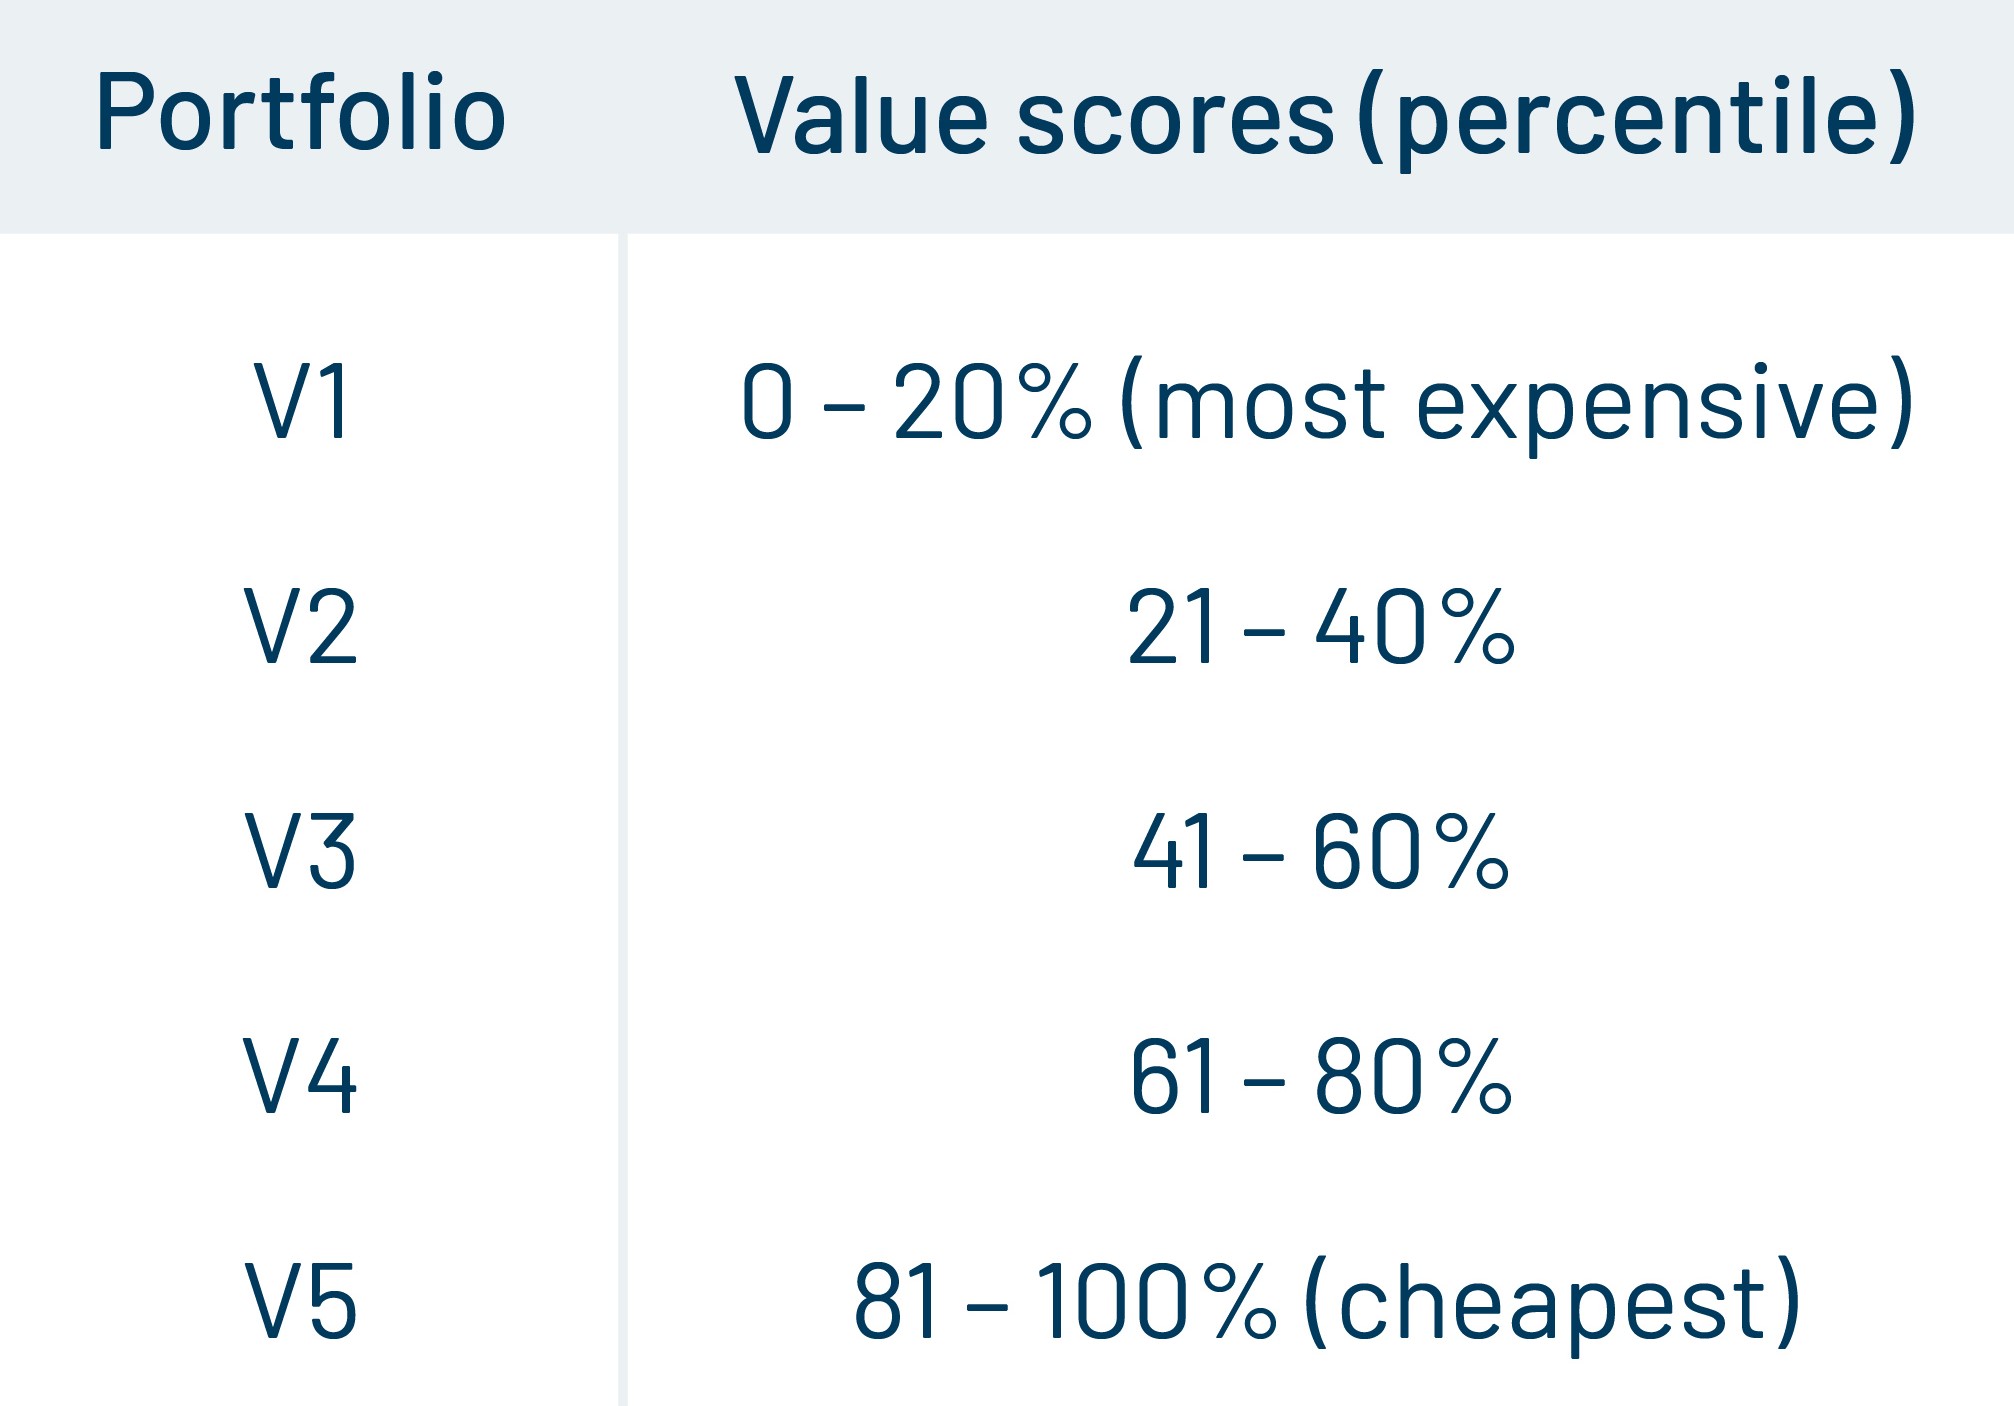
To test this on large- and mid-cap stocks, which make up our relevant universe, we created five portfolios by dividing S&P BSE 200 companies into sub-portfolios of 40 companies each based only on their valuation metrics. We used conventional valuation ratios used by most active managers: Price-to-Book, Price-to-Cash Earnings, Price-to-Earnings, EV to EBIT, FY1 Price-to-Earnings, Dividend Yield, and FY1 Dividend Yield.
The companies were assigned a composite value score using data available at the end of each quarter. The portfolios were rebalanced on a quarterly basis. Thus, in sum, five equally weighted portfolios, each consisting of 40 stocks belonging to the S&P BSE 200, were created based on their valuation scores.
The first portfolio, ‘V1’, has the most expensive stocks, those with the lowest scores on value metrics. At the other end of the spectrum, ‘V5’ comprises the cheapest stocks, those with the highest scores on value metrics.
*Equally weighted portfolios created from the S&P BSE 200 based on valuation scores. Each portfolio has 40 stocks. Portfolios are rebalanced quarterly. Data from 31 December 2002 to 31 August 2022. The valuation data is sourced from MSCI Barra.
The results are depicted below:
Table: Annualised returns of the different portfolio quintiles
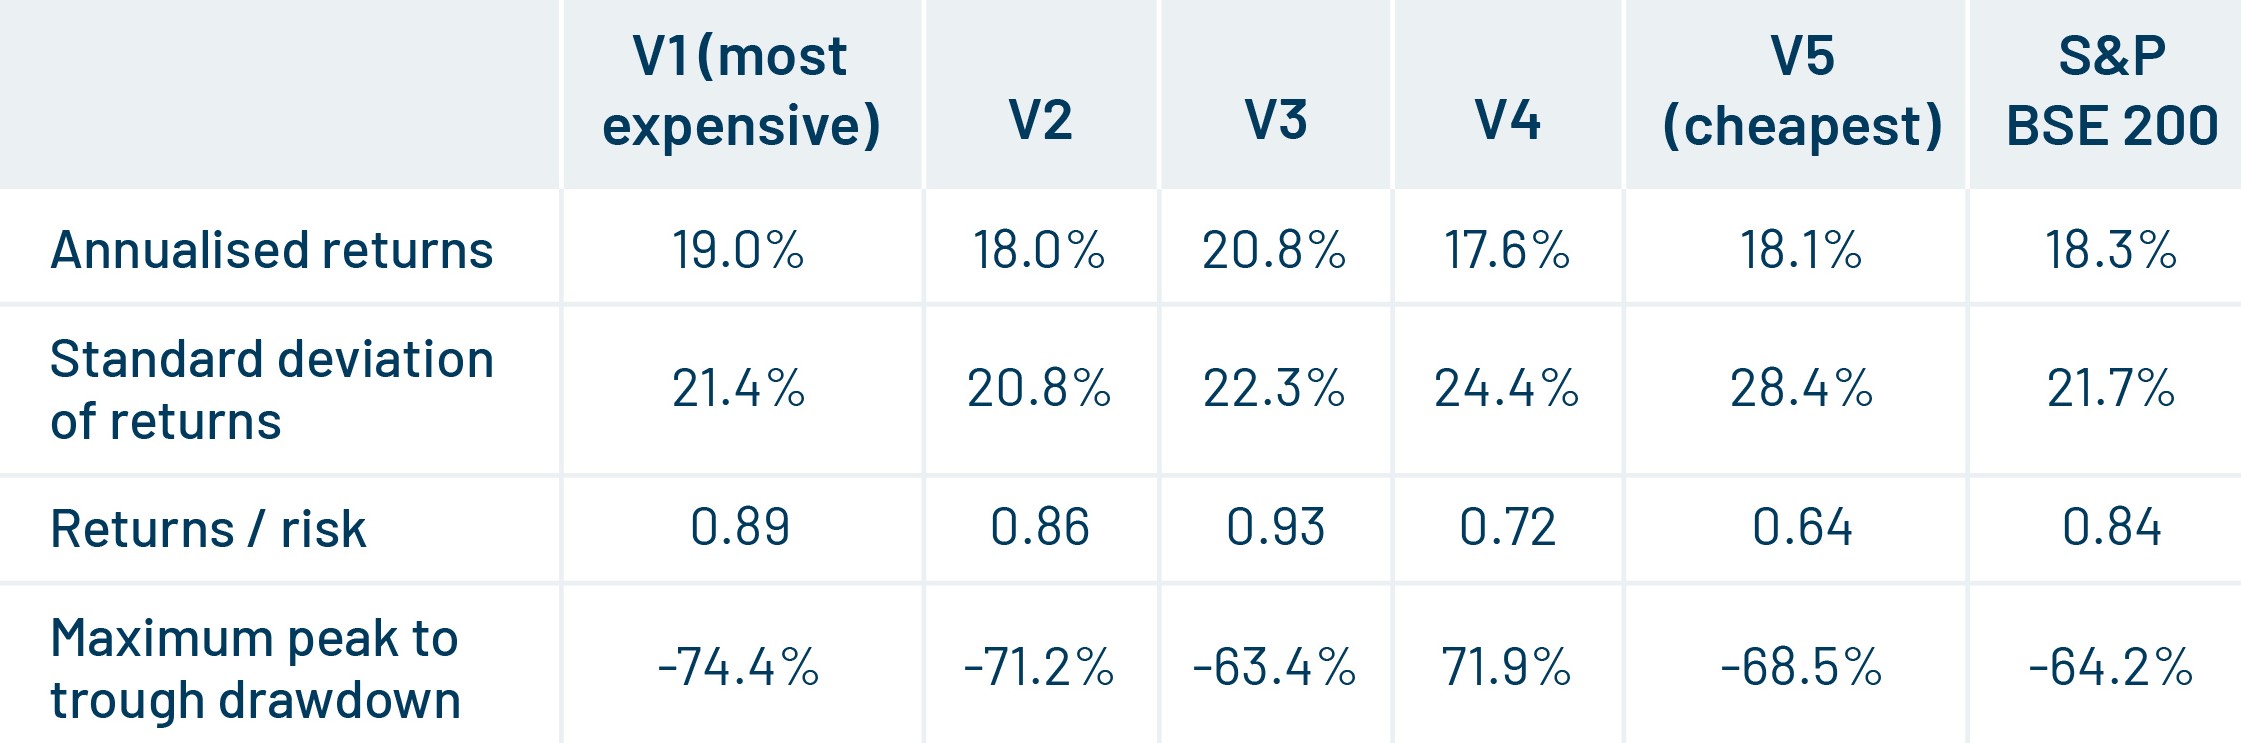
The results do not indicate any systematic underperformance of the ‘expensive’ V1 portfolio relative to either the benchmark (S&P BSE 200) or to the ‘value’ V5 portfolio. This is consistent with the findings that we had published earlier in 2019 in our Factor Investing Primer, which you can read at the link provided herewith.
The results show that valuation considerations using traditional valuation metrics alone do not materially affect the ultimate return outcomes. Being invested in the cheapest portfolios will not automatically lead to outperformance. Conversely, being invested in the most expensive quintile does not automatically lead to underperformance. Our conclusion is that there are other factors which need to be analysed along with valuation metrics (which makes perfect sense: the real world is complicated, after all!)
Not only this – we also see that the returns generated by the ‘value’ V5 portfolio are more volatile as compared to the ‘expensive’ V1 portfolio. Again, this is not surprising given that value stocks tend to be more cyclical, and offer ‘value’ (i.e. are cheaper) precisely because they may be facing headwinds caused by economic cycles, or specific business-related headwinds.
However, while the end results are similar, each portfolio does go through periods of significant outperformance and underperformance with respect to the broader indices. This is normal, as research has shown that various factors demonstrate cyclicality. Being aware of these extremes can help investors tactically readjust portfolio allocations in favour of the underperforming style.
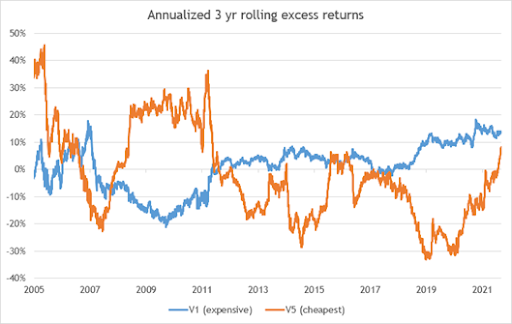
Graph: 3-year daily rolling excess returns V1 (expensive) vs V5 (value) portfolios (annualised returns)
Excess returns = V1 / V5 portfolio annualised returns – S&P BSE 200 annualised returns
The chart below shows how the excess returns generated by the V1 and V5 portfolios over a 3-year horizon changed with time. The last 2 years indicate a huge outperformance by V5 relative to V1.
Valuation + Profitability
Because low valuations are often associated with value traps which most prudent investors will naturally want to avoid, we looked at adding one more dimension to the above analysis, namely: profitability. Again, the question we sought to answer was:
- Do inexpensive (value) companies that also have high profitability have a systematically better performance?
- Among expensive companies, is there a systematic difference between the returns for low-profitability companies and high-profitability companies?
‘Profitability’ is measured using Gross Profitability (Gross Profits by Total Assets), Asset Turnover, Gross Profit Margin, and Return on Assets.
We identified companies that fall within a 2x2 Value-Profitability matrix and created four quarterly rebalanced, equally weighted stock portfolios out of the same S&P BSE 200 universe.
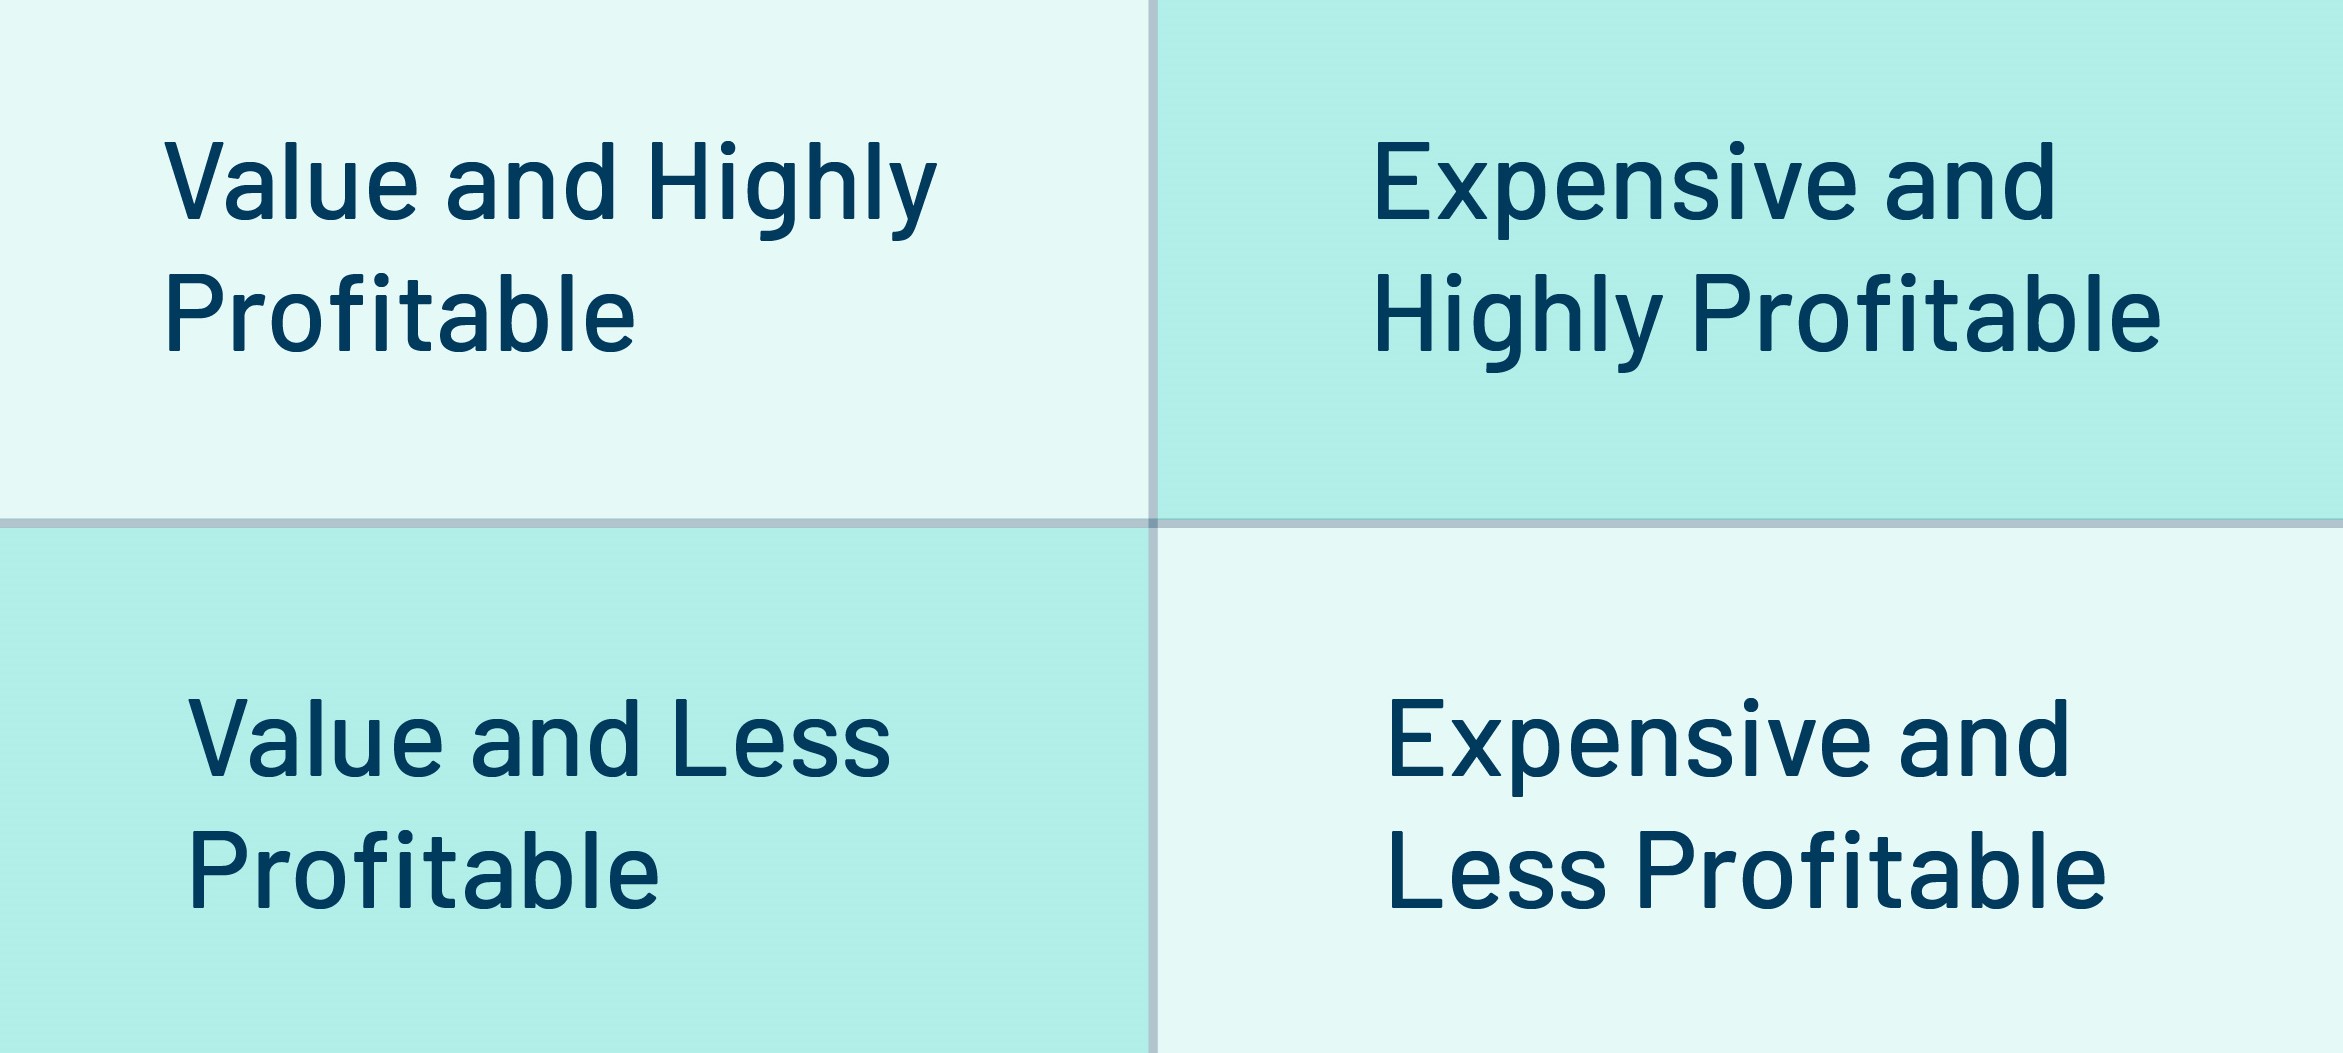
Value and Highly Profitable: The subset of companies that appear both in the top 2 Value quintiles as well as the top 2 Profitability quintiles.
Expensive and Highly Profitable: The subset of companies that appear both in the bottom 2 Value quintiles as well as the top 2 Profitability quintiles.
Value and Less Profitable: The subset of companies that appear both in the top 2 Value quintiles as well as the bottom 2 Profitability quintiles.
Expensive and Less Profitable: The subset of companies that appear both in the bottom 2 Value quintiles as well as the bottom 2 Profitability quintiles.
Data from 31 December 2002 to 31 August 2022
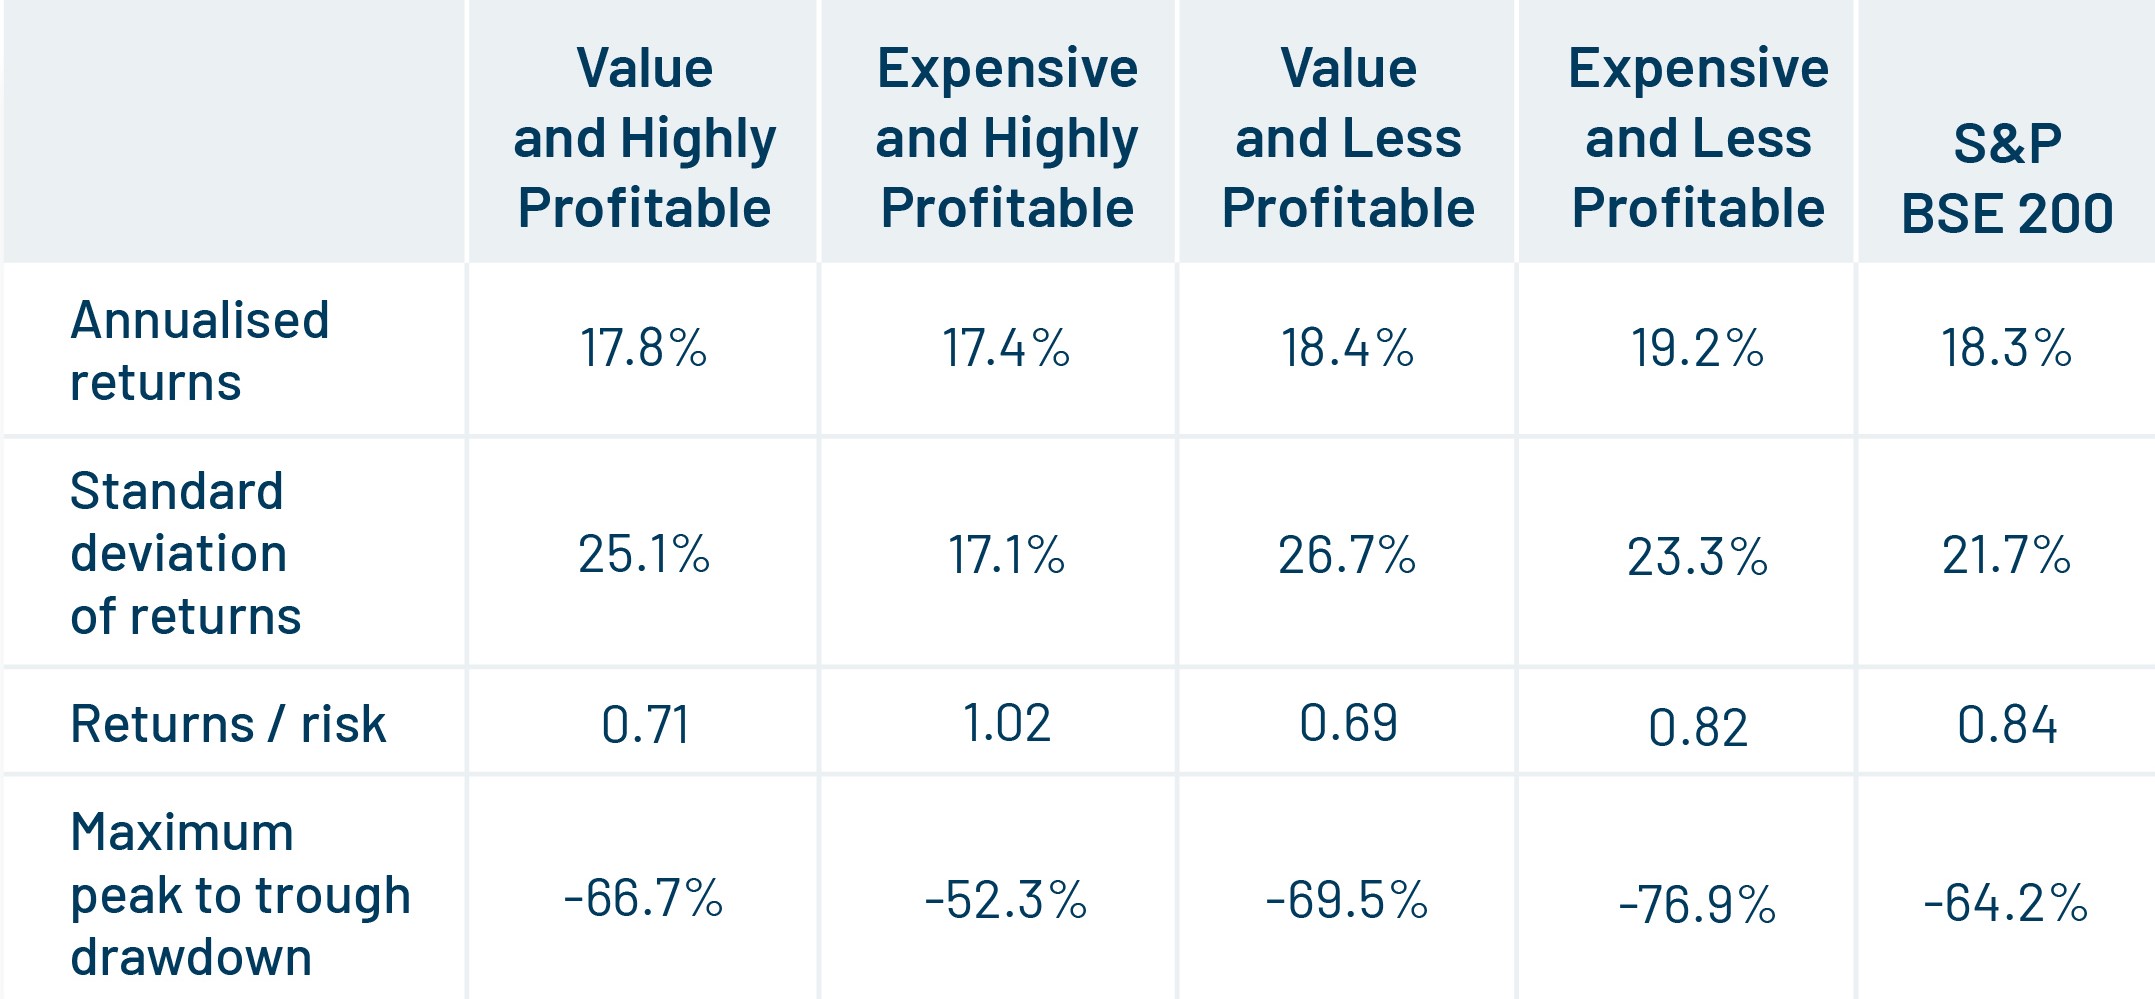
Here, we do not see any systematic underperformance of expensive portfolios, irrespective of profitability. The expensive-profitable combination showed the best risk-adjusted returns.
Our conclusion from the above analysis is that investors don’t need to take sides or choose either one of the ‘quality’ or ‘value’ styles. We suggest that investors take advantage of having portfolio allocations in line with both styles. The inherently mean-reverting nature of the styles as seen from the rolling 3-year returns chart also shows that chasing recent high-performers will prove to be a self-defeating exercise.


Leave a comment