
When Noelle was a toddler, her father told her that she was a princess.
He would lift her to their window and show her their beautiful, colorful kingdom, and they would celebrate the beauty and fragrance that surrounded them.
She admired her father’s royal robes and the crown he wore upon his head. He even revealed the source of his wealth - he and his subjects would go out in the early mornings to collect silver from the lake. Sometimes, on a clear day, she could see men hauling in their bags filled with silver. Noelle even got a chance to eat that silver!
Once Noelle was of school-going age, her father enrolled her into the finest of institutes, which meant she had to move into another palace in another part of their kingdom. There she discovered that their ‘kingdom’ is actually a fishing village, the ‘silver’ being hauled in daily is actually fish, and the ‘fragrance’ is the stench of the fishing village. She found out that her father does not have subjects but fellow-fishermen, and his robes are actually rags. His crown is nothing but a flat turban to help him balance his fish basket on his head.
Noelle only discovered this reality when she got the chance to compare her life to the rest of the world. The “fragrance” of the fish only turned into a stench when she had smelled other things. The robes turned to rags only when she saw other clothes.
In other words, taken in isolation, your options are always fabulous.
Let’s put this in the context of investing. That stock you’re looking at with so much hope and anticipation; how does it size up against other stocks? How does it compare to its own history? When taken in context of how much of a return it can deliver, does it still display potential? Is it really the golden egg you’d been hoping for?
A simple answer to these questions is PE ratio and EPS.
What are PE ratio and EPS?
PE Ratio stands for Price to Earnings Ratio, and EPS stands for Earnings Per Share. These ratios could give you a clearer picture of a stock’s true worthiness as an investment.
PE Ratio and EPS give investors the much needed context and a scale for comparison when looking at various stocks as potential investments. Known as valuation ratios, PE Ratio and EPS offer comparative analysis of a certain stock.
What do PE ratio and EPS tell investors? How can investors use them?
The most common use of PE ratio is to gauge the valuation of a stock or an index. The perception is that PE ratio tells investors whether a stock is undervalued or overvalued (how much more the investors are willing to pay for a stock as compared to the earnings it is likely to deliver). But this is not entirely true. The PE ratio is more of a reference than an absolute indicator of value.
The general consensus is that a high PE ratio suggests that investors are anticipating a higher earnings growth (in comparison to peers with a lower PE ratio). A low PE ratio would indicate that investors are not willing to pay a high price for the shares of the company.
You don’t want to be paying Rs 2,000 for every Rs 100 earned, so the lower the PE ratio, the better. This is not to say you should completely avoid stocks with a high PE ratio. It only means that higher the PE ratio, more is the money you will need to shell over the actual worth of the stock.
Meanwhile, Earnings Per Share is an indicator of the profitability of the company - how much money a company makes per share of stock issued. A high EPS means that the income generated by the company is more and that it has more profits to distribute to its shareholders. The higher the EPS, the better is the profitability of the company. A negative EPS indicates that a company could possibly be loss-making, and investors may be better off being wary of associated risks.
Used in tandem with each other, PE ratio and EPS can give an investor a balanced view of a potential investment. Even if a company is likely to deliver a high return (indicated by a high EPS), the investor is diluting his profits if he is buying an overvalued stock, or paying too much for a stock (as indicated by a high PE ratio).
How are EPS and PE ratio calculated?
The calculation methods for both ratios are simple and straightforward:
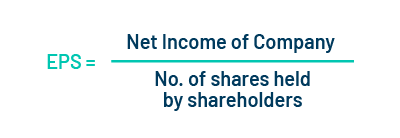
- EPS is arrived at by taking the net income earned by the company and dividing it by the number of shares held by all its shareholders.

- P/E ratio is calculated by dividing the share price by the earnings per share.


Why is knowing EPS and P/E important?
Seeing a kingdom where there is actually a fishing village
As we learned from Noelle - our friend from the story at the start of this article - looking at a stock in isolation might lead you to miscalculate its potential to deliver returns. You might end up seeing a kingdom where there is actually a fishing village.
You are at risk of buying an overvalued stock - that means you are paying an inflated price, more than it is worth.
Let us take the example of a fictitious company: Antar Face Masks Pvt Ltd, that is listed on stock exchanges as a pharma retailer. There is a lot of noise around the company right now because it has registered incredible profits on account of skyrocketing demand for masks amid the coronavirus pandemic.
Its numbers look encouraging. Antar boasts 12-month gross earnings of Rs 15,00,000 and its net earnings over the last 12 months stand at Rs 12,00,000. A total of 200,000 shares are held by its shareholders. Antar’s share price is Rs 120, having risen drastically owing to buyer confidence amidst great demand for masks in the current scenario.
All looks good for Antar, and Rajiv has decided that he will invest in the company’s shares. Rajiv figures that until a vaccine is distributed to millions and millions of Indians, there will still be demand for masks. Therefore, there is no going wrong here. However, Rajiv’s friend Raghav insists that he has an incomplete picture. He gets Rajiv to look at the PE ratio and EPS for Antar and compare them with a couple of other companies before investing.
He does an EPS calculation: 12,00,000 ÷ 2,00,000 = 6. The earnings per share is Rs 6.
Then he uses the EPS to do a quick P/E ratio calculation: 120 ÷ 6 = 20
In comparison, Bunny Biotech, which manufactures and retails dermatology and hair care products, has an EPS of 80 and a P/E Ratio of 5.
Wimmen Pharma, which sells regular over-the-counter vitamins, their own branded paracetamol, a handful of painkillers, and also face masks, has an EPS of 60 and a P/E Ratio of 5.
Clearly, although Antar has witnessed huge growth in the corona-period, it does not display the same earnings potential and competitive valuation as its peers. It would not be prudent for Rajiv, or any investor for that matter, to proceed with buying a stock without looking at it through the lens of valuation ratios.
The other members of the valuation ratios family:
Although we are focussing specifically on the two most popular ratios in this particular discussion, there are several valuation ratios that can be used to take a closer look at stocks. These are:
- Price to book ratio: Valuation metric used to evaluate a company’s stock price relative to its book value.
- Price to sales ratio: Valuation metric that compares a company’s stock price to its revenues.
- Price to cash-flow ratio: Valuation metric used to evaluate how much cash a company generates relative to its stock price.
- PEG ratio (price/ earnings to growth ratio): Valuation metric used to assess the relationship between a stock’s PE ratio and projected earnings growth rate in a timeframe. It helps investors put a price to the company’s rate of growth.
Pros and cons of PE Ratio and EPS
As discussed, PE ratio and EPS together give investors a more realistic picture of a given stock’s actual potential to deliver earnings at its current price. However, they can also be misleading if used completely in isolation. For example, earlier in this discussion, we compared Antar with Wimmen Pharma. Antar had an EPS of 6 and a PE ratio of 20; whereas Wimmen Pharma had an EPS of 60 and a PE ratio of 5. Does that mean that Wimmen Pharma is most definitely the way to go? The honest answer is, possibly not. Here is why:
1. There could be some other reason for a low PE ratio. For instance, maybe a momentary drop in share price has occurred due to the company’s very successful CEO moving to a new job? Investors should ideally also look at headlines around the company to see if any recent numbers are prompted by some knee-jerk reaction.
2. When forward PE ratio is used, the company or the analysts involved could overestimate or underestimate earnings. Investors commonly compare forward PE and trailing PE in order to get a balanced idea of the stock’s valuation.
3. Similarly, when it comes to earnings per share, investors may or may not receive a portion of the company’s earnings. Some companies do not distribute dividends. In that case, it is the share price that matters and not the EPS (except for use in valuation).
Overall, no ratio or indicator can give investors a completely fool-proof idea of where a stock price will head. The stock market is dynamic and swayed by a number of social, political and economic factors. Investors must never lose sight of this reality, no matter what yardstick they decide to use before buying a stock.


Leave a comment