-1.jpg)
Let me start this with an interesting question...
When was the first-ever loan given? Any guesses?
If you are done with your guesses, continue reading!
Okay, time for a confession. No one knows exactly when this happened. According to historical records currently accessible, the first loans are estimated to have been sanctioned at least 3,700 years ago.
Here is an excerpt of lending guidelines from the Babylonian text ‘Code of Hammurabi’ which was inscribed back in the 18th Century BCE.

Source: Cornell University Library, Louvre, Archive.org
And back home, Arthashastra (written almost 2200 years ago) notes the usage of a cheque-like instrument named ‘Adesa’ during the Maurya period.
So clearly, banking and financial services have been around for thousands of years.
While several other sectors and themes have come and gone, the Banking and Financial Services (BFSI) sector has been and continues to be The Structural Story.
To get a glimpse of this structural story, let us look at how the Banking and Financial Services sector has fared in the last two decades...
In the last 15-20 years, the BFSI sector has gone through troubled times led by the Global Financial Crisis (Lehman Bros & Bear Stearns shut down), European Debt Crisis, Taper Tantrum, Demonetization, NPA crisis, NBFC Crisis, Banking troubles in India (GTB, Yes Bank, LVB, etc.,) and the West (Credit Suisse, SVB, etc.).
To put it mildly, things haven’t been easy for the BFSI sector!
But what if I tell you that despite these ‘bad’ events, the Banking & Financial Services sector has grown faster than the economy?
Between FY08 and FY23, India’s nominal GDP grew at an annualized rate of 12.1%. In the same period, the different subsegments of the banking & financial services grew at a faster (or at least similar) pace.
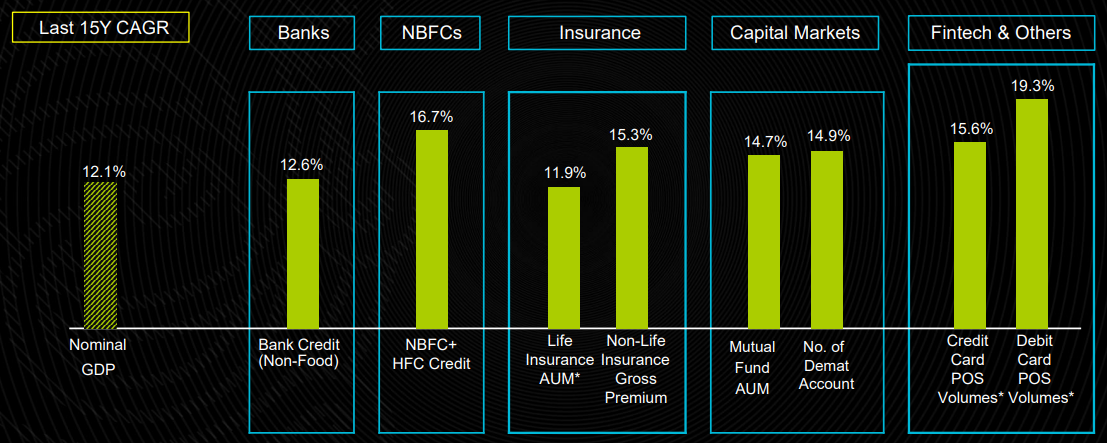
Source: CMIE, Kotak Securities, IRDAI, Investec, CDSL, NSDL. 15Y CAGR for the period FY08 to FY23. *Life Insurance AUM and Card POS Volume CAGR is for the period FY12 to FY23. BFSI – Banking, Financial Services & Insurance. CAGR – Compound Annual Growth Rate. NBFCs – Non-Banking Financial Companies. HFC – Housing Finance Companies. POS – Point of Sale. AUM – Assets Under Management
Okay, but the returns surely must have taken a hit?
Not really.
Despite challenges, the Nifty Financial Services TRI (which can be taken as a proxy for the BFSI sector) delivered a CAGR of 17.6% between Jan-04 and Sep-23 versus 14.0% for Nifty 50 TRI.
The money invested in the Nifty Financial Services index in Jan-04 multiplied over 24 times in 19-odd years!
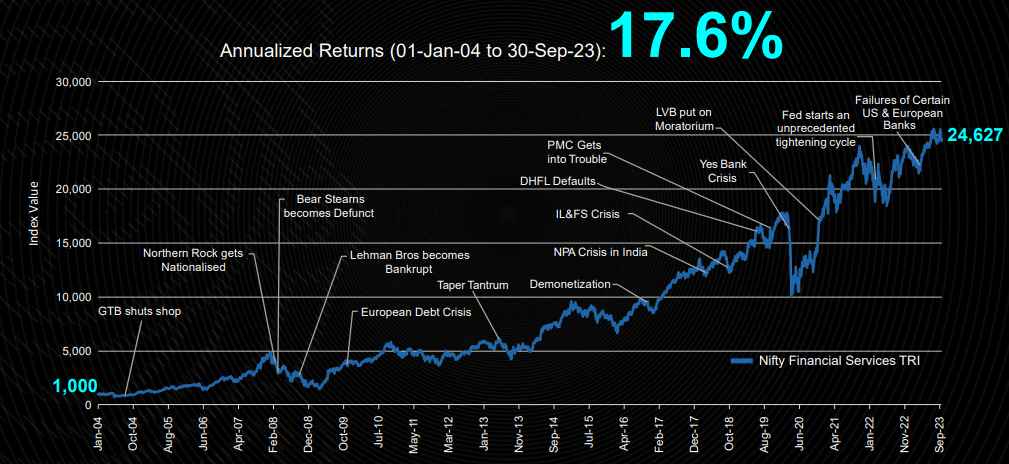
Source: Internal. Index Values from MFI Explorer. Data for the period 01 Jan 2004 to 30 Sep 2023. BFSI – Banking, Financial Services & Insurance. Nifty Financial Services Index is taken as a proxy for BFSI sector. Past performance may or may not be sustained in future and should not be used as a basis for comparison with other investments. These figures pertain to performance of the index/model and do not in any manner indicate the returns/performance of this scheme.
And the BFSI returns historically have been better and more consistent compared to the broader Nifty 50 index across periods.
Nifty Financial Services TRI has outperformed Nifty 50 TRI on all 10-year periods since 2004. And nine out of ten times, the Nifty Financial Services TRI has delivered annualized returns greater than 12% over a 7+ year timeframe (vs 52% for Nifty 50 TRI).
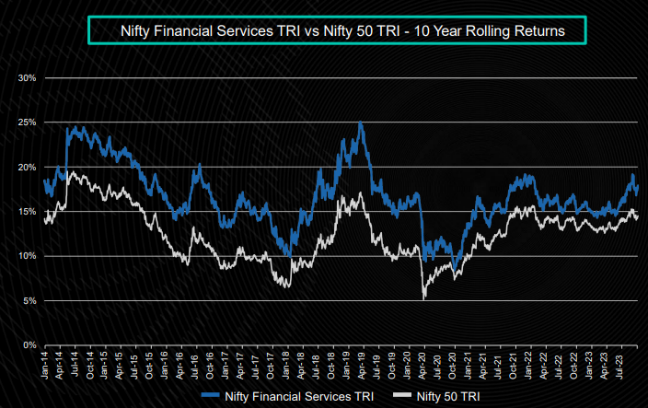
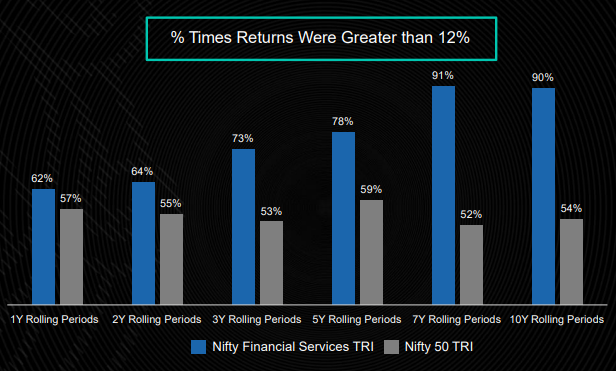
Source: Internal. Index Values from MFI Explorer. Data for the period 01 Jan 2004 to 30 Sep 2023. BFSI – Banking, Financial Services & Insurance. Nifty Financial Services Index is taken as a proxy for BFSI sector. Past performance may or may not be sustained in future and should not be used as a basis for comparison with other investments. These figures pertain to performance of the index/model and do not in any manner indicate the returns/performance of this scheme. There is no assurance of any returns/capital protection/capital guarantee to the investors in the Scheme. The Scheme being sectoral in nature carries higher risks versus diversified equity mutual funds, thus one should take controlled exposure to such funds.
Now that the structural story is clear, let us look at the current set-up of the Indian BFSI sector...
While Banking & Financial Services is thematic in nature, it comprises of multiple subsegments including Banks, NBFC, Life and Non-life Insurance, Asset Management Companies, Exchanges, Depositories and Credit Rating Agencies which make it very diversified.
A snapshot of the BFSI subsegments can be seen below:
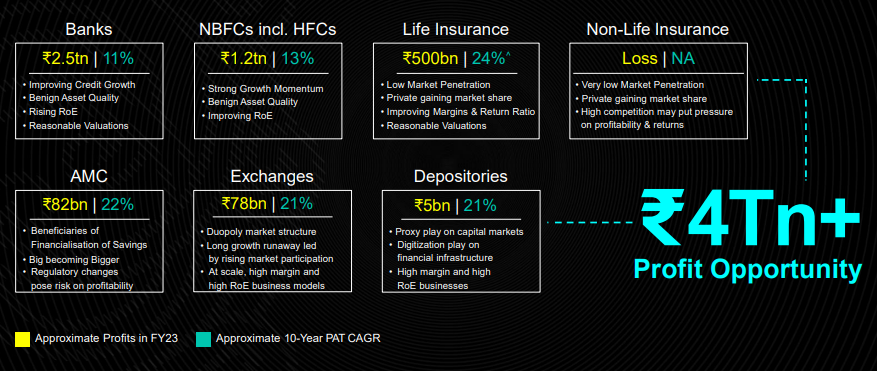
Source: RBI, Kotak Securities, Morgan Stanley Estimates, Investec, Spark Capital Research, Internal. Note: ^Value of New Business CAGR for the period FY18- 23 is shown for life insurance (listed private players only). Non-life Insurance data excludes reinsurance. NBFCs – Non-Banking Financial Companies. HFC – Housing Finance Companies. AMC – Asset Management Companies. RoE – Return on Equity. CAGR – Compound Annual Growth Rate. The sector(s)/stock(s)/issuer(s) mentioned in this document do not constitute any recommendation of the same and the Fund may or may not have any future position in these sector(s)/stock(s)/issuer(s).
Put together, all the sub segments amounted to a whopping Rs. 4 lakh crore profit pool in FY23!
However, the BFSI space is still under-penetrated.
Despite its strong structural growth over the years, the Indian BFSI sector remains under-penetrated when compared to other major economies.
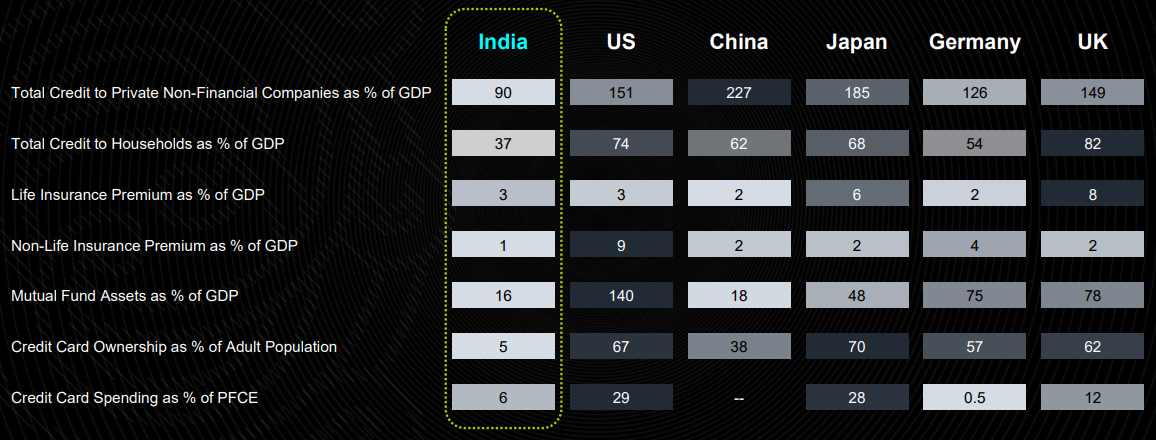
Source: World Bank, BIS, Swiss Re Sigma World insurance report No 3 /2023, Kotak Securities, Internal. Total Credit to Households as % of GDP and Total Credit to Private Non-Financial Companies as % of GDP data are as of Q1 CY23. Life/Non-Life Insurance Premium to GDP is as of 2022. MF Assets to GDP is as of 2020. Credit Card penetration data are as of 2021. Adult population considers people aged 15 and above. Credit Card Spending as % of PFCE data for China is not available. PFCE – Private Final Consumption Expenditure.
This lower penetration across segments promises a strong growth runway for the future.
So, should you consider investing in the Banking & Financial Services sector?
You might have already guessed our answer.
But let me give you three key reasons as to why now seems to be a really good time to invest in the Banking and Financial Services sector.
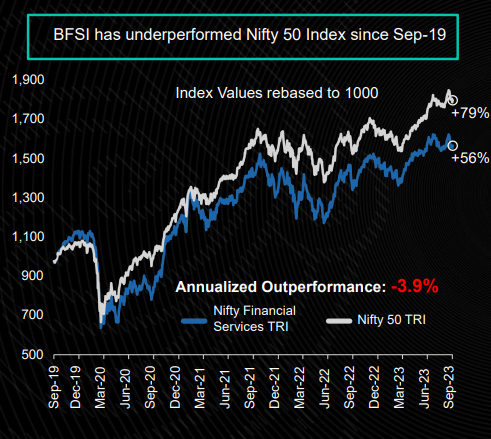
1. Sharp underperformance in the last four years indicates the possibility of a turnaround
The BFSI sector has seen a sharp underperformance compared to the broader index. Nifty Financial Services TRI has underperformed Nifty 50 TRI by 4% CAGR since Sep-19. This underperformance on a 4-year rolling basis is closer to the underperformance levels last seen during the Global Financial Crisis in 2008.
Historically such phases where the Nifty Financial Services index underperformed the Nifty 50 index on a 4-year rolling basis have been good entry points to invest in BFSI.
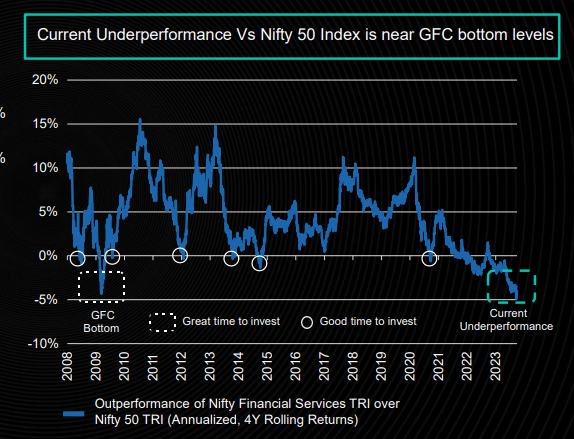
Source: Internal. Index Values from MFI Explorer. Data for the period 01 Jan 2004 to 30 Sep 2023. BFSI – Banking, Financial Services & Insurance. GFC – Global Financial Crisis. Past performance may or may not be sustained in future and should not be used as a basis for comparison with other investments. These figures pertain to performance of the index/Model and do not in any manner indicate the returns/performance of this scheme.
2. Reasonable valuations
The BFSI sector currently trades at valuations closer to historical averages – offering a reasonable entry point.
.png?width=556&height=323&name=image%20(6).png)
.png?width=578&height=344&name=image%20(7).png)
Source: Kotak Securities, NSE, Internal. P/B – Price to Book Value. The sector(s)/stock(s)/issuer(s) mentioned in this document do not constitute any recommendation of the same and the Fund may or may not have any future position in these sector(s)/stock(s)/issuer(s).
3. Strong balance sheets and profitability
Bank balance sheets are currently strong with non-performing loans close to all-time low levels. This could help with a sustained pick-up in credit growth.
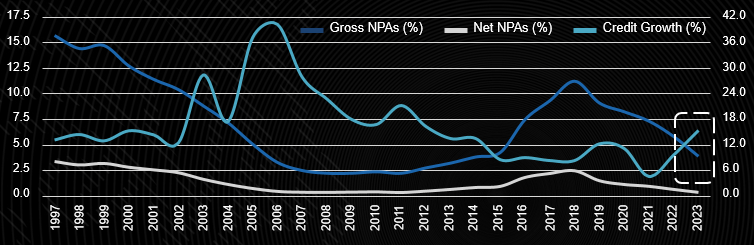
Source: RBI, Kotak Securities, Morgan Stanley, Internal. Data as of 31 Mar 2023. NPA – Non Performing Assets. Note: NPA data is only for banks. The sector(s)/stock(s)/issuer(s) mentioned in this document do not constitute any recommendation of the same and the Fund may or may not have any future position in these sector(s)/stock(s)/issuer(s).
Plus, the profitability of the BFSI sector has also been quite strong with the return ratios at decent to high levels.
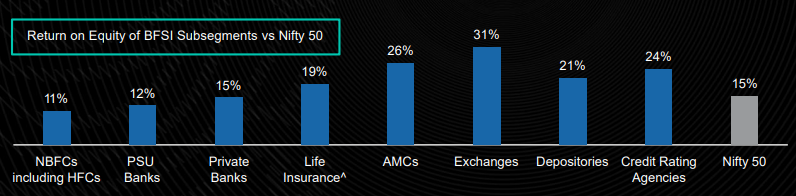
Source: RBI, Kotak Securities, Morgan Stanley, Internal. Data as of 31 Mar 2023. BFSI – Banking, Financial Services & Insurance. ^For life insurance, Return on Embedded Value is taken and the number shown considers only private sector listed players (public sector listed insurer’s RoEV data is not available). The sector(s)/stock(s)/issuer(s) mentioned in this document do not constitute any recommendation of the same and the Fund may or may not have any future position in these sector(s)/stock(s)/issuer(s).
Summing it up...
The Structural Story
- Banking and financial services sector has been around for thousands of years and continues to be a strong growth story
- Despite facing multiple challenges in the last two decades, the BFSI sector has largely outpaced the economy and delivered a CAGR of ~17%. Currently, the profit pool is over Rs 4 lakh crore spread across diversified subsegments
Still Underpenetrated
- Indian BFSI sector remains under-penetrated when compared to other major economies and offers growth potential
3 Reasons to Invest in BFSI Sector Now
- Sharp underperformance in the last four years versus the broader Nifty 50 index - Possibility of a reversal
- Reasonable valuations
- Strong balance sheets and profitability
Conclusion
With a legacy spanning a millennia and a dynamic present characterized by resilience and potential, the BFSI sector in India continues to be a compelling narrative of growth and evolution. Its ability to weather storms, coupled with a promising future marked by underexplored growth avenues, positions the sector as a cornerstone of the country's economic narrative. Embracing its historical significance and understanding its current dynamics, investors can discern the promising prospects that lie within the ever-evolving landscape of Indian banking and financial services.


Leave a comment